🎯 Design a Scalable System to Monitor AI/ML Training Workloads
🚀 Prompt:
Design a system that monitors distributed AI/ML training jobs across thousands of compute nodes (e.g., GPUs/TPUs) running in Google Cloud.
The system should collect, process, and surface metrics like:
GPU utilization
Memory consumption
Training throughput
Model accuracy over time
It should support real-time dashboards and alerts when anomalies or performance degradation are detected.
🔍 1. Clarifying Questions
Ask these before diving into design:
-
How frequently should metrics be collected? (e.g., every second, every minute?)
-
Are we targeting batch training jobs, online inference, or both?
-
Do we need historical analysis (long-term storage), or just real-time?
-
Should users be able to define custom metrics or thresholds?
🧱 2. High-Level Architecture
[ML Training Nodes]
     |
     | (Metrics via agents or exporters)
     v
[Metrics Collector Service]
     |
     | (Kafka / PubSub)
     v
[Stream Processor] -----------+
     |                        |
     | (Aggregated Metrics)   | (Anomaly Detection)
     v                        v
[Time Series DB]        [Alert Engine]
     |
     v
[Dashboard / API / UI]
🧠 3. Component Breakdown
A. Metrics Collection Agent
-
Lightweight agent on each ML node
-
Exports GPU usage, training logs, memory, accuracy, etc.
-
Use formats like OpenTelemetry, Prometheus exporters
B. Ingestion Layer (Pub/Sub or Kafka)
-
High-throughput, fault-tolerant transport layer
-
Decouples training nodes from processing
C. Stream Processing
-
Use Apache Flink, Dataflow, or Beam
-
Tasks:
-
Aggregation (e.g., avg GPU utilization every 10s)
-
Metric transformations
-
Flag anomalies
-
D. Storage Layer
-
Time-Series DB: InfluxDB, Prometheus, or Bigtable for long-term
-
Can partition per job ID, node ID, timestamp
E. Alerting & Anomaly Detection
-
Rules-based + ML-based anomaly detection (Z-score, drift detection)
-
Push to:
-
Stackdriver alerts
-
Email/SMS/Slack/etc.
-
F. Dashboard/UI
-
Real-time graphing (Grafana / custom UI)
-
Heatmaps for job status
-
Historical comparisons
🧠 4. Key Considerations
📈 Scalability
-
Must support 100K+ jobs
-
Shard by job or region
-
Horizontal scale on collectors and processors
⏱️ Latency
-
Near real-time (<5s) for alerts
-
Use caching and batch windowing to reduce pressure
🔐 Security
-
Authentication for agents
-
Role-based access control for metrics
🧰 Extensibility
-
Plug-in support for new ML frameworks (TensorFlow, PyTorch)
-
Custom user-defined metrics
📊 Optional Enhancements (Great to Mention!)
-
Model drift detection via training-vs-inference delta
-
Auto-throttling or re-scheduling of slow jobs
-
Integration with Google Vizier for HPO feedback loop
📣 What Google Might Ask
-
How do you handle data loss if a node crashes?
-
How would you store and index petabytes of metrics?
-
What trade-offs do you make between real-time vs. cost?
-
How would you test this system under stress?
Absolutely — let’s break down strong, Staff-level answers to the “What Google Might Ask” section of the system design interview, tailored for the CMCS ML role.
🔍 1. How do you handle data loss if a node crashes?
Answer:
To minimize data loss from node crashes:
-
At the agent level:
-
Metrics are buffered locally with a short TTL (e.g., 5–10 minutes).
-
If the Pub/Sub push fails (e.g., network blip), retry logic with exponential backoff is implemented.
-
-
At the transport layer (Kafka or Pub/Sub):
-
Ensure at-least-once delivery semantics.
-
Use acknowledgment-based processing to ensure downstream consumers only process committed messages.
-
-
In stream processors:
-
Stateful operators checkpoint to persistent storage (e.g., GCS, BigQuery).
-
If the processor crashes, it can resume from the last consistent state.
-
This layered fault-tolerance ensures end-to-end durability and reduces the blast radius of any individual component failure.
⚙️ 2. How would you store and index petabytes of metrics?
Answer:
-
Use a time-series optimized storage engine like:
-
Bigtable or OpenTSDB for massive scale and horizontal partitioning.
-
Or Prometheus for short-term, and Google Cloud Monitoring or BigQuery for long-term historical aggregation.
-
-
Sharding keys:
job_id,node_id,timestamp— this enables parallel writes and targeted reads. -
Cold storage: Older data beyond 30 days can be aggregated and offloaded to GCS or BigQuery for cost efficiency.
-
Indexes:
-
Composite indexes on
job_id + timestampormetric_type + job_statusfor alerting and dashboard queries.
-
Petabyte-scale systems require aggressive pre-aggregation, time bucketing, and TTL policies to keep operational cost low.
🧠 3. What trade-offs do you make between real-time vs. cost?
Answer:
This is all about balancing SLOs with system complexity and cost:
| Real-time Focus | Cost-Efficient Focus |
|---|---|
| <5s latency | ~1 min latency |
| Raw metric granularity | Batched/aggregated metrics |
| More compute and storage | Lower infra costs |
-
For critical alerts (e.g., GPU stalled, accuracy dropped), we prioritize low-latency processing.
-
For dashboards or weekly reports, we rely on aggregated/batch pipelines.
We may run dual pipelines:
-
Fast path → Stream (Flink/Dataflow) for real-time.
-
Slow path → Batch (BigQuery/Beam) for cost-optimized archival.
🧪 4. How would you test this system under stress?
Answer:
A combination of load, chaos, and soak testing:
🔧 Load Testing:
-
Simulate 100K concurrent training jobs publishing metrics every second.
-
Use tools like Locust or K6, or write a custom gRPC emitter.
💥 Chaos Testing:
-
Inject faults using Chaos Monkey-style scripts:
-
Kill nodes
-
Drop metrics
-
Induce network partition
-
🕰 Soak Testing:
-
Run the system continuously for days to check for:
-
Memory leaks
-
Buffer overflows
-
DB index performance degradation
-
✅ Metrics to Monitor:
-
System throughput
-
Event lag
-
Error rates
-
GC/memory usage
🚀 Bonus: How would you make this system self-healing?
Answer:
-
Use Kubernetes to auto-restart unhealthy pods (agents, collectors).
-
Health checks + alerts trigger incident workflows.
-
Auto-scale components based on message backlog (e.g., Pub/Sub lag).
-
Design for idempotent and stateless processing wherever possible.
Here's a one-to-one mapping of the components used in the Google Cloud-based ML monitoring system design with equivalent Azure services, so you’re fully prepared if asked to design on Azure Cloud instead.
🔁 Google Cloud to Azure Mapping for ML Workload Monitoring System
| Component | Google Cloud | Azure Equivalent |
|---|---|---|
| Metrics Ingestion (Queue) | Pub/Sub | Azure Event Hubs or Azure Service Bus |
| Stream Processing | Cloud Dataflow (Apache Beam) | Azure Stream Analytics or Azure Data Explorer (ADX) |
| Or use Apache Flink on Azure HDInsight / Synapse | ||
| Metrics Collector Service | Custom service + GKE | Custom app hosted on Azure Kubernetes Service (AKS) |
| Time-Series Storage | Bigtable / Prometheus / Cloud Monitoring | Azure Data Explorer (Kusto DB) or Azure Monitor Metrics |
| Historical / Long-Term Storage | BigQuery / GCS | Azure Data Lake / Azure Synapse Analytics |
| Dashboard / Visualization | Grafana / Looker / Cloud Monitoring UI | Azure Monitor Dashboards, Power BI, or Grafana on Azure |
| Alerting / Notifications | Cloud Monitoring + Alerting | Azure Monitor Alerts, Action Groups, Log Analytics Alerts |
| Custom ML Workload Monitoring | TensorBoard / Custom Agents | Azure ML Monitoring or Application Insights SDK |
| Container Orchestration | Google Kubernetes Engine (GKE) | Azure Kubernetes Service (AKS) |
| Security / IAM | IAM / Service Accounts | Azure Active Directory (AAD) / Managed Identities |
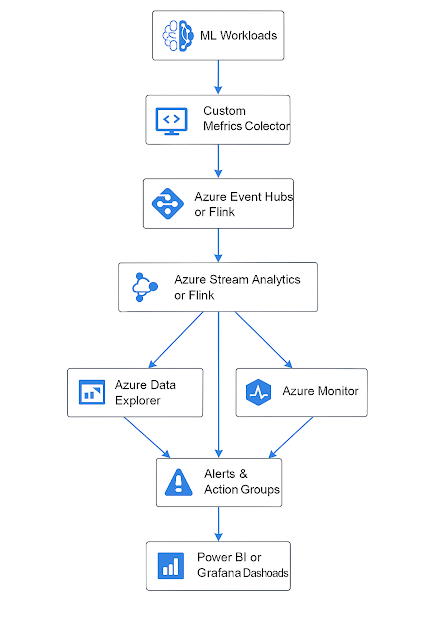
🧠 Example: Full Azure-Based Architecture Flow
[Training Nodes with App Insights SDK]
      |
      v
[Custom Metrics Collector (on AKS)]
      |
      v
[Azure Event Hubs]
      |
      v
[Azure Stream Analytics / Flink]
      |
+----------------+------------------+
|                |                  |
v                v                  v
[Azure Data Explorer]      [Azure Monitor]       [Alerts & Action Groups]
      |
      v
[Power BI / Grafana Dashboards]
🛠️ Notes on Azure-Specific Features
-
Azure Monitor + Log Analytics can capture near-real-time telemetry from ML jobs if using Application Insights SDK or custom exporters.
-
Azure Data Explorer (ADX) is optimized for time-series and telemetry — excellent for ML metrics storage and querying at scale.
-
Azure ML now includes some native monitoring capabilities like tracking accuracy, drift, and CPU/GPU metrics per job.
No comments:
Post a Comment